
The ACCESS Metrics team has a challenging task with a simple sounding description: monitor NSF-funded ACCESS cyberinfrastructure facilities. In other words, the team measures the usage and performance of ACCESS cyberinfrastructure (CI) resources, including compute, cloud, storage and networking.
Why is this important? First of all, these resources are typically over-subscribed with researchers’ jobs queued, waiting for others to finish. By keeping track of and analyzing the use of these resources, the Metrics team can find ways to maximize usage through improved system and application performance. This is far from an academic exercise since even small changes in performance can translate to a big impact for end-users of these systems. According to the Metrics team, every 1 percent increase in system performance on ACCESS resources allows the allocation of an additional 101 million CPU hours annually. Assigning a monetary value of 5 cents a CPU hour, that adds up to an annual savings of over $5 million.
Among the many functions the Metrics team performs is its work understanding and optimizing resource use and performance through the ACCESS Monitoring and Measurement Services (MMS). Some of the benefits team members bring to the ACCESS program include:
- Providing a wide range of utilization metrics
- Measuring Quality of Service of CI systems and applications
- Measuring and enabling job improvement and system-level performance
- The ability to carry out workload analyses on ACCESS systems to help inform computing system upgrades and procurements
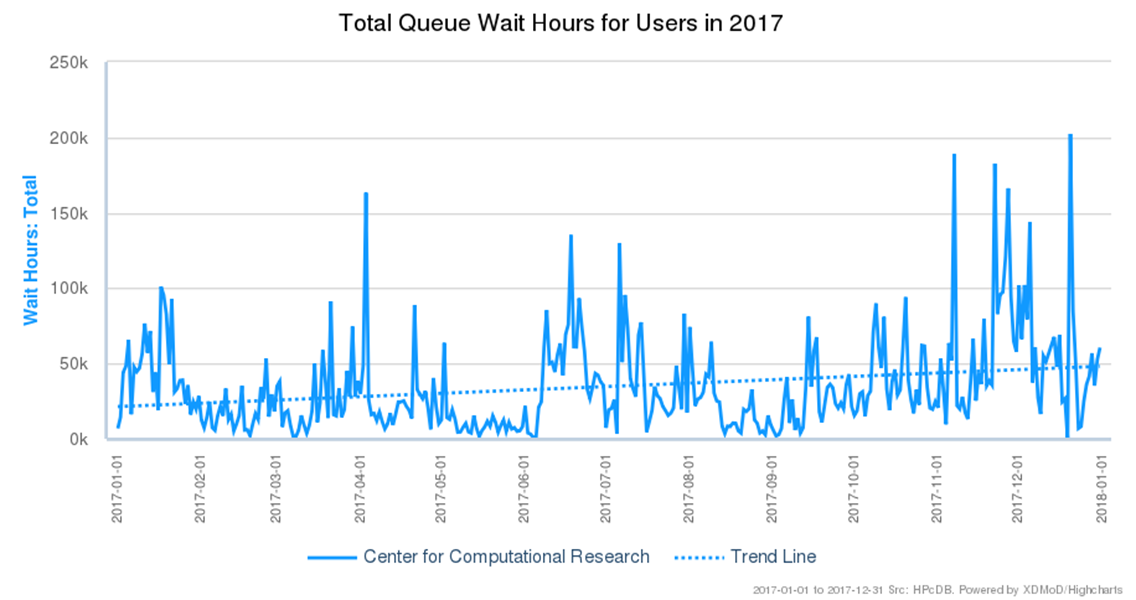
The Metrics team not only works at the national level to improve ACCESS resources but can also aid at the local or campus level. With the tools provided by ACCESS MMS, HPC centers can better manage their CI resources to help ensure that they are providing the greatest return on investment possible for the institution as well as meeting the researcher’s needs. Also, by monitoring metrics such as overall usage and queue wait times, they can help center leadership make the case for additional investments in CI by their campus administration or external funding agencies such as NSF and NIH. This is shown in the figure below in which the total queue wait times were shown to be increasing over time, making the case that additional computational resources were needed.
Much of this is accomplished through XDMoD (XD Metrics on Demand), the open-source tool developed by the Metrics team. In addition to ACCESS, XDMoD is used by over 400 HPC centers worldwide. XDMoD can be used to glean valuable insights into job performance and usage, which can ultimately help researchers improve job throughput and, importantly, minimize their time to science.
Transition from XSEDE to ACCESS
Moving from the XSEDE environment to the ACCESS environment was a great deal of work for all the teams within ACCESS. Metrics was no exception. Here are some of the tasks they completed during this transition.
- Moving XMS to ACCESS MMS – changing from the monitoring system that was used for the previous 10 years in XSEDE to the new monitoring and measuring system required the team to make sure historical data was maintained and that the process didn’t disrupt access to the XDMoD service.
- Transitioning the data sources needed by XDMoD from XSEDE to ACCESS required careful planning and coordination with the other ACCESS tracks.
- Transitioning of the web presence – the metrics team not only created and launched its website but also migrated the XDMoD portal.
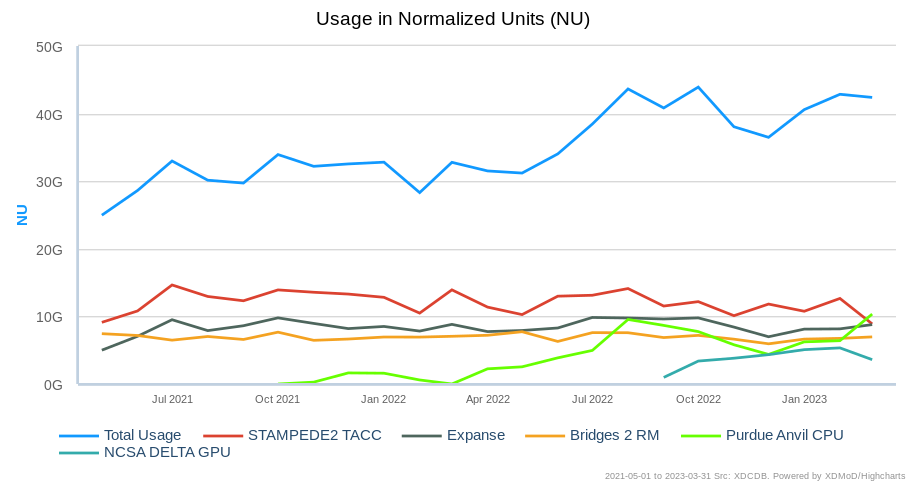
The first rule of the transition from XSEDE to ACCESS was to “do no harm”; that is to ensure that there was no impact on the researchers utilizing XSEDE resources as they transitioned to ACCESS. ACCESS MMS played a key role in comparing the utilization of the CI resources pre- and post-transition to ACCESS to confirm that indeed, the transition from the perspective of the researchers did not negatively impact their ability to carry out their science. As shown in a sample plot below, the usage pre- and post-transition remained steady.
Creation of a new service model
The Metrics team has put a lot of effort into creating a service model that best fits the new ACCESS ecosystem. The new service model supports each of the teams within ACCESS by providing them with information tailored to their needs, which is as follows:
- Allocations – Metrics makes historical CI usage for individual users/projects and overall CI resource usage available to this team.
- Support – Metrics provides detailed information about researchers’ jobs, including detailed job level performance data.
- Operations – Metrics provides information on ongoing ACCESS operations, including QoS metrics for the ACCESS CI resources.
- ACO – Metrics provides information to support its management, oversight and coordination of the ACCESS awardees.
Creation of a new Data Analytics Framework
As a requirement of the ACCESS solicitation, the Metrics team was tasked with creating a data analytics framework for facilitating data analyses for a wide range of stakeholders. The new framework provides direct API access to the rich repository of usage and performance data contained in XDMoD data warehouse and democratizes access so that data scientists can utilize whatever tools they prefer to carry out their analysis; hereby allowing for analyses that are not possible using the XDMoD web portal. The user interface is based on the widely utilized Jupyter notebooks with Python and R interface options facilitating advanced analyses. The team plans to leverage the new framework to facilitate workload analysis and improve features for automatic reports.
The new framework will be implemented in July 2023 and will have an initial set of training materials ready by that time.
Network data monitoring
Data movement is increasingly important for computation, simulation and large-scale experimental facilities. As data sets become larger and larger, keeping that data moving in a timely and efficient way is crucial to handle the sheer volume. Efficient data movement also reduces latency, improves overall system performance, minimizes bottlenecks and maximizes computational throughput. That’s why the Metrics team has started monitoring network data usage for ACCESS resources.
The team plans to deploy NetSage which will gather data transfer information from all Resource Providers. The system will collect SNMP and flow data. You’ll be able to find this data in NetSage dashboards in ACCESS XDMoD.
National Cyberinfrastructure Monitoring and Simulation
ACCESS is NSF’s flagship cyberinfrastructure program but it’s only a part of the total CI ecosystem supported by NSF. Indeed, campus and cloud-based CI play an ever-increasing role in the national CI ecosystem. Despite the importance of campus and cloud-based CI, it’s currently not possible to measure their impact on the national CI ecosystem. ACCESS MMS hopes to rectify this through a federated XDMoD version that can monitor not only ACCESS CI but also Campus Cyberinfrastructure (CC*) and cloud-based CI to provide a holistic view of the National CI ecosystem.
MMS is also developing CI simulators to model how well the current CI is supporting research and to suggest how to invest in future facilities to optimize this support.
ACCESS Metrics team members, Robert DeLeon, Thomas Furlani and Joseph White contributed to this story.